How can you measure the success and opportunities of a cybersecurity program? With so many risks, threats, vulnerabilities, and exploits in the wild it’s difficult for security leaders to clearly articulate what they are focused on, and why they are focused on it.
Cybersecurity metrics are measurements and tracking of important indicators that help tell the story of what, where and why security leadership is focused on specific initiatives.
Every company is unique and along with it comes a distinct and original set of risk. Because of that unique risk, each business will have it’s own unique indicators to measure and collect as a port of their cybersecurity metrics program. But even across diverse industries and verticals, there remains a common framework of metrics that support security initiatives.
In this article, we will explore some key areas you can track and attempt to measure to include in your cybersecurity metrics program.
Secret Sauce
As always, before implementing a solution and collecting information I like to start with a position of understanding the unique risk to the business. Even this risk, or set of risks, can be qualitatively measured to reveal the risk story.
For a retail organization, the biggest risks to the company might be account take over and point of sale compromise.
For a financial company, the biggest risks might be a compromise of private deal files, initial public offering information, and wire fraud attempts.
For the healthcare organization it could be a compromise of PHI data across a diverse technology environment, and compromise of client-facing devices (IoT) inside patient rooms.
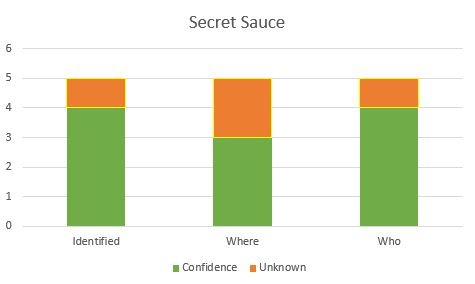
Start by measuring these tops risk on a scale of one through five with the following questions:
- How confident are we as an information security organization that we know what we are trying to protect?
- We know where all of this high-risk data exists within the environment.
- We know who, and what (service accounts/applications) have access to that data.
Build a graph or visual representation of this information.
Asset Management
An issue I see frequently is the concern that the security organization does not know what all the assets are within the business.
The ability to document, track, query, and apply metadata to assets is called asset management. The process of managing assets can be done manually, or automatically. It can be done on paper, spreadsheets, using software applications, or even SaaS applications. How you manage the assets is a separate issue than ‘if’ you manage the assets.
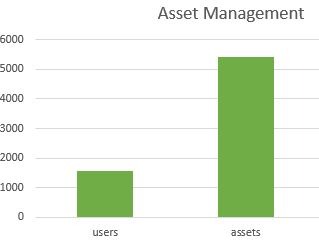
A strong metrics program depends on a strong asset management program. The goal should be to at least have a number (in percentage) of how many assets within the company is being documented and managed. This number can be used as a variance indicator to your other metrics. Such as,
“We are managing 5,432 technology assets in our asset management system that includes all technology devices connected to our corporate network via wire, wireless, or cloud. We are confident this number is accurate to within 96%.”
This statement says a lot. It says you have an asset management program, you know what you’re documenting, where those assets are, and that you’re not ignorant to thinking everything is in there.
When someone can’t tell me how confident they are of what percentage of assets are being documented in their asset management system, I will either ask more questions or assume very low confidence in the system to base other metrics off of.
I also assign much higher confidence in a system measurement that has an accurate measurement of less than %100, than if they are %100 confident they know of everything. The statement of confidence that everything is known and documented will require more proof and justification than now know everything.
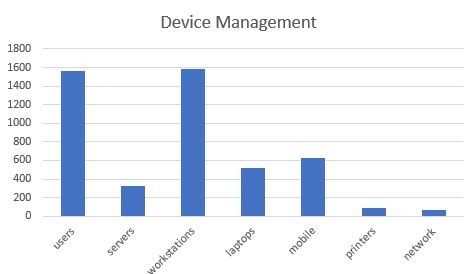
Once you have a system for documenting your assets, break them down into technologies how you feel appropriate, such as; servers, workstations, laptops, printers, network devices, and such. Graph it out. For scale, I like to put ‘user count’ as a sidebar for reference. This will often add helpful context to the device count.
Users
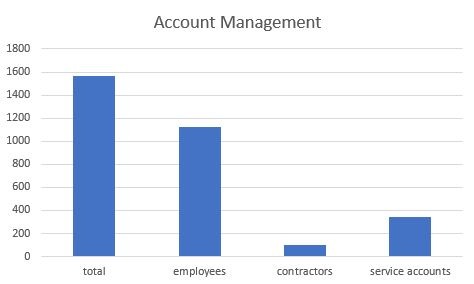
A number that is more concrete and easy to provide is the current number of users. This should be broken down by employee count, contractors, and service accounts.
Often there can be systems and applications within the business that have diverse account management. If these systems fit into the risk you’re attempting to measure they should be included in your count by first identifying them as separate credentialed systems, but including the total user count as one total across all systems.
Up until this point the viewers of your report have been seeing a ‘user count’ on the sidebar for reference. This is the opportunity to show and explain why there are so many more users than employees. This will explain justify why the risk might be larger than the intail belief.
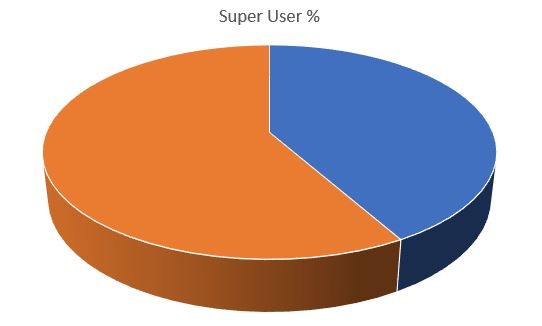
A powerful measurement I encourage people to include as part of the user report is how many users (physical and service accounts) have administrative privileges. This can be to the user store or domain. They also provide a measurement of how many users have administrative rights to endpoints (workstations and laptops). I like to display this as one number that shows the total number of users that have admin rights including workstation users, domains administrators, workstations administration, and any other group or service account.
Locations
Including locations use to be very important for companies that had national office locations, or global footprints. Then as technology matured, it became less important because the risk was not changed based on location.
The new location measurement is ‘on-site’, ‘cloud’ and ‘vendor’.
As more and more data and critical applications move to the cloud this reporting metric really provides a visual opportunity to see where the risk is. If the balance is shifting to external vendors it can help drive your thrid-party risk assessment and vendor management program.s If the risk is shifting to the cloud it can help drive policy for unification and cloud security controls.
Conclusion
Starting with the basics for metrics will provide a solid foundation as you begin to stack threats, exploits, investigation, and the history count of incidents on top.
Join us in the next article when we will build on top of these metrics to start to tell the story of where the highest priorities should be based on the measurements we’ve collected.

Recent Comments